Many current maps and satellite images follow on this continuously updated page.
Here are some highlights:
*************************************************************************************************************************************
During hurricane season, see
meteorologist Rob Lightbown's Atlantic Tropical Weather Discussion & Advisories at
www.crownweather.com. The small fee is well worth it.
*************************************************************************************************************************************
The 2024 hurricane season begins June 1 and ends November 30, but the NHC will start issuing tropical weather updates on May 15 since
in recent years storms
have been forming earlier.
More on hurricane names is here.
REAL-TIME HURRICANE NEWS FROM THE NATIONAL HURRICANE CENTER:
*****************************************
CURRENT TROPICAL WEATHER OUTLOOK
*****************************************
CLICK THIS LINK
Use the "Back" Button on your browser to return to this page
*******************************************************
CURRENT / MOST RECENT TROPICAL STORM & HURRICANE
ADVISORIES
AND FORECAST TRACKS
*******************************************************
If there are no current storms, the most recent storm still appears.
Currently active storms are listed below, boldfaced.
Click This Link for the ADVISORY on 2024 storm TCPAT1 ===
Use the "Back" Button on your browser to return to this page
Click This Link for the ADVISORY on 2024 storm TCPAT2 ===
Use the "Back" Button on your browser to return to this page
Click This Link for the ADVISORY on 2024 storm TCPAT3 ===
Use the "Back" Button on your browser to return to this page
Click This Link for the ADVISORY on 2024 storm TCPAT4 ===
Use the "Back" Button on your browser to return to this page
Click This Link for the ADVISORY on 2024 storm TCPAT5 ===
Use the "Back" Button on your browser to return to this page
********************************************
CURRENT TROPICAL WEATHER DISCUSSION
********************************************
(Click this link only if you're a weather geek -- lots of info here)
Use the "Back" Button on your browser to return to this page
**********************************************
CURRENT SXM AND US- RELATED SATELLITE IMAGES
**********************************************
Current Weather Images: All maps are
satellite images, updated as frequently as every half hour, courtesy of
NOAA unless otherwise noted.
If you see no images, the NOAA server is
down.
IMPORTANT! If you come back in a couple of hours to recheck these
images to see where storms are moving (and how fast), when
the image
loads check the upper left corner. It tells you the date and Greenwich
Mean Time (GMT) of the image (time + Zulu, indicating
GMT). If the
time hasn't changed since you last viewed the image, click your
browser's REFRESH button. Then you'll get the new image.
(In the
name of efficiency, browsers store files -- even ones which update
around the clock.)
Again, if an image fails to appear here, the
weather
site is down.
********************************************
GRAPHICAL TROPICAL WEATHER OUTLOOK:
********************************************

*****************************************
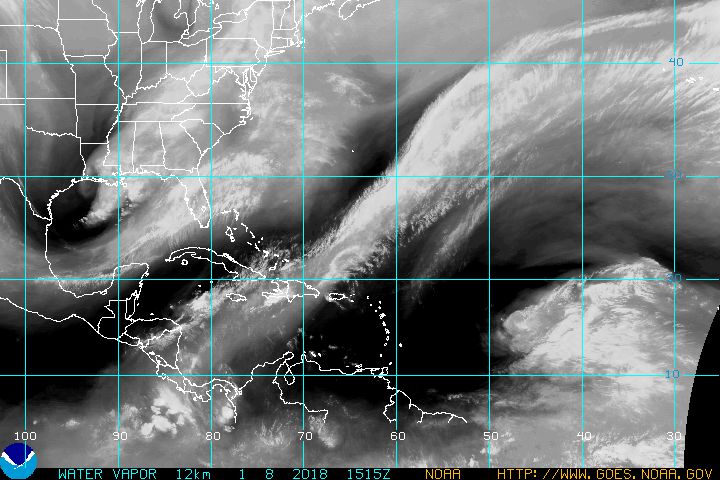
WATER VAPOR SATELLITE IMAGES
****************************************

***********************
REGIONAL WEATHER RADAR (when available; from San Juan Airport)
***********************

*****************
WIND ANALYSIS
*****************
Live Current Tropical Atlantic Satellite Image
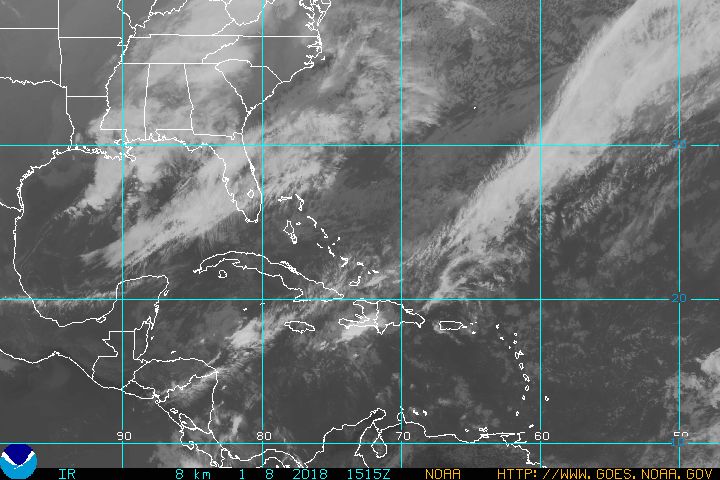
Current Infrared Satellite -- Western Atlantic / Caribbean (NEW)

Puerto Rico Region Infrared Satellite Image (when available; often nonfunctional)

To return here after visiting any page on another site, click the "back" button on
your browser.
We publish current images direct from NOAA; if no image appears,
that because there is none from NOAA at the moment.
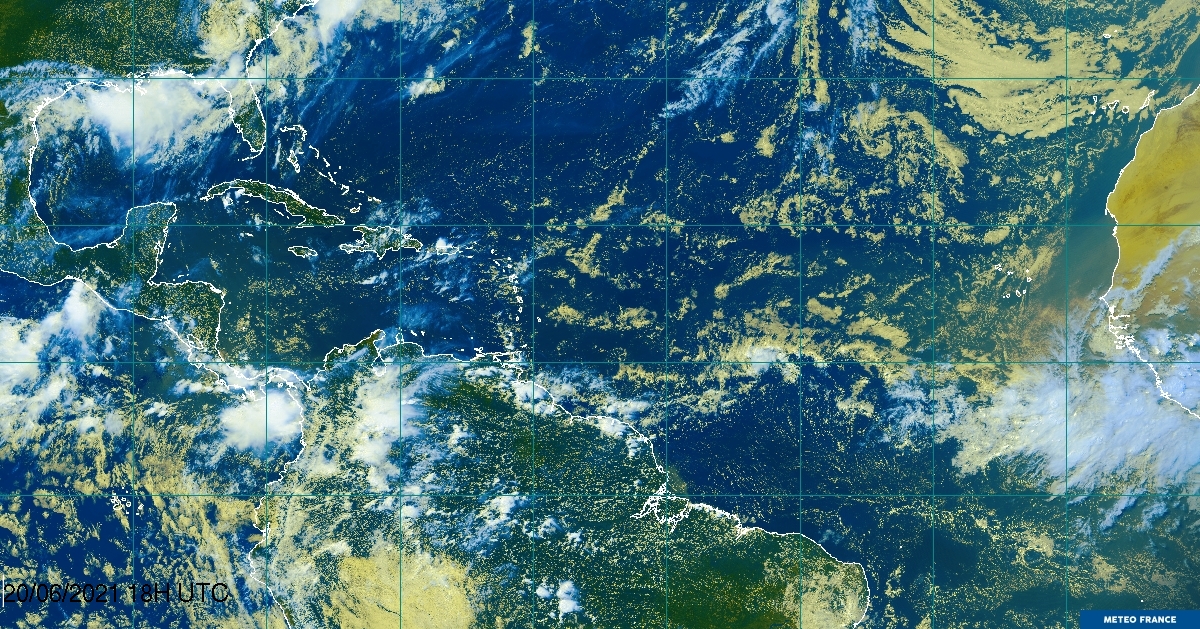
Meteo France Current Satellite
Current Atlantic Hurricane / Storm Map

*******************************************************************
NEW: CARIBBEAN ANIMATED SATELLITE IMAGE
*******************************************************************

====ALL THE BELOW IMAGES CAN BE
CLICKED TO SEE A LARGER VERSION IN A SEPARATE WINDOW====
Marine Graphic - Prospectively Developing or Developed
Subtropical Storms, Tropical Storms, and Hurricanes

********************************************
Currently Active Atlantic / Caribbean Tropical Cyclones
(Click this link)
2024 Storms
********************************************
Storms Crossing Africa East to West . . .
During the Cape Verde Season (mid August to mid October),
Significant Atlantic Tropical Waves Are Born Here
Image may not appear
Tropical Waves Exiting the African Coast
During the "Cape Verde" (NHC now calls it Cabo Verde) season from August through mid October, this
is where storms threatening SXM usually come from. Waves move east to
west just north of the "Intertropical Convergence Zone" (ITCZ). Focus on
storms between 10 and 20 degrees north.... Starting in late July,
"shearing"
winds over the tropical Atlantic begin to diminish, heralding
the beginning of the Cape Verde season. Its peak is September. Satellite
photos update constantly.

Atlantic Basin Water Vapor Imagery
Why is this significant? Storms encountering dry air tend to lose
strength; those traveling in moist air can maintain or gain strength,
depending on other conditions.
Current Southeast U. S. A., Caribbean, and Gulf of Mexico
Satellite Image
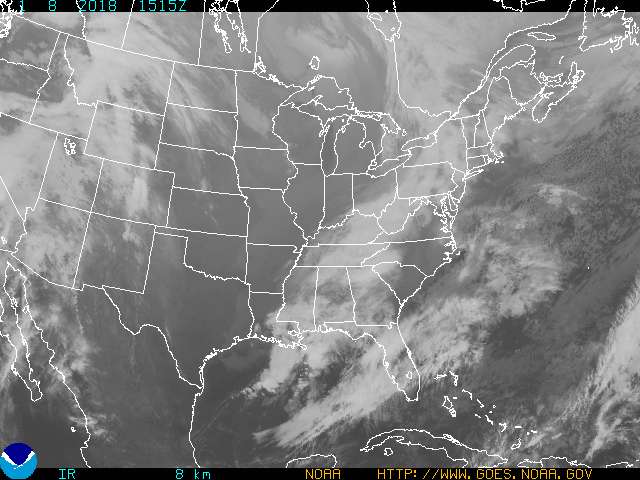
A US Continental Weather Satellite Image, of interest
when the US Gulf or East Coast is threatened by any storms --
year round:
Atlantic / Caribbean
/ Gulf of Mexico
Tropical Storm &
Hurricane Forecast Models/Map(s):
Atlantic / Caribbean / Gulf Coast Tropical Storm & Hurricane
Forecast Models: Images May or May Not Appear; Multiple Images Cover
Multiple
Storms (updated for each storm; courtesy South Florida Water Management District.)

****************************************************************
Current Caribbean Tropical Weather Activities (Radar Loop)
CLICK LINK FOR RADAR LOOP:
http://www.ssd.noaa.gov/goes/east/tatl/flash-vis.html
******************************************************************
Click your "back" button to return to this page.
The Entire North Atlantic

Copyright, ©, JMB Communications, 2023; world rights reserved.
Graphic content courtesy NOAA unless otherwise indicated. Images updated
24/7/365.